Quality control of illumina reads
This module will guide you on how to go about quality control of data generated by the MiSeq. The objectives of this section are to
- Visualise the quality of your reads
- remove any adapter sequences present in the data,
- remove all bases with a Phred quality score of less than 20,
- graph the distributions of quality scores and nucleotides, and
- calculate the fractions of duplicate and singleton reads in the data.
What is a FASTQ file?
Once the sequencing is finished, the data becomes available for download as "fastq" text files, in which each short read takes up four lines:
- Legend
The first line (starting with an @) is a read identifier,
the second is the DNA sequence,
the third another identifier (same as line 1, but starting with a +(or sometimes only consisting of a +))
the fourth is a Phred quality score symbol for each base in the read.
 Illumina's current sequencing pipeline (as of January 2012) uses an offset of 64, so that an @ (ASCII code 64) is 0, and h (ASCII code 104) is 40 (104-64)
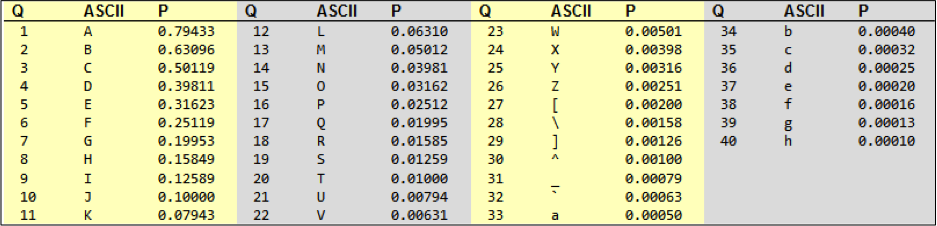
- (Other versions of the pipeline might use different offsets, however. If you have data with a different offset value, you will need to modify your commands accordingly to inform programs that this is the case).

Checking the Quality of the Sequencing reads using FASTQC
-
Using Graphical User Interface (GUI)
Using the GUI is easy and intuitive. However it is time consuming, and cannot handle multiple files at a time (Batch processing). However, it is ideal when you want a quick look at few fastq files.
To use the GUI, you need:- Have a suitable Java Runtime environmnet installed in your computer
- Install an X11 client for your machine, such as XQuartz. If you are using MobaXTerm, this is not necessary, as X11 is part of the software.
- Enable X11 forwarding during login, by logging in using the -X parameter
ssh -X username@hpc.ilri.cgiar.org
module load fastqc After a second or two, a fastqc splash screen will appear.
fastqc
To do a QC on your file, click onFile | Open | Browse to where you have saved your sequences and select them. The analysis will start immediately, and you will be able to browse through the results. -
Using command line
As previously illustrated, using command line interface (CLI) is much more powerful, fast and convenient when handling and processing multiple files at a go, as compared to the Graphical User Interface (GUI).
After logging in,cd to the directory where your sequences are, then type:module load fastqc where sequence1 sequence2 sequence3 are the fastq sequence files.
fastqcsequence1 sequence2 sequence3 ... sequenceN
Alternatively, if you have many fastq files and would like to do analysis for all of them you could use an asterix ‘*’ as shown below to select all sequences with the extension ‘.fastq’.fastqc *.fastq The sequences are saved in the current directory as a HTML, and as a zip file. Download the Zip file to your local computer, Unzip it, then open the html file to visualise your result.
To have a good understanding of the good data vs bad data, click on the following links: - Good quality sequences
- Bad quality sequence
Removal of adapter sequences
Trimming your data would be the next step after looking at its quality and making judgment on what data you need to trim. From the QC reports generated by FastQC it is possible to see if you have adapter contamination. It is necessary to cleave off these adapters.- Adapter trimming using Scythe If you have two adapters per sample in paired end sequencing one for the R1 and R2 fastq files, scythe would be a better program to use.
- Adapter trimming using Fastx-Toolkit If you have one adapter per sample fastx_clipper, a utility program under FASTX-Toolkit is a good tool to use. Ensure you are working in the directory holding your raw reads.
You need to make an adapter.fasta file for each sample. Use
>N02
ATCGTGG
>N05
AFCTCTA
scythe –a adapter.fasta read_R1.fastq -o read_R1.ad.fastq
scythe –a adapter.fasta read_R2.fastq -o read_R2.ad.fastq
You will notice that each command produces some output to your terminal, summarizing the number of reads in which adapters were detected and trimmed out.
It can be useful to save a record of this output. You can incorporate this into the original command a way to redirect the stdERR output to a file see below
scythe –a adapter.fasta read_R2.fastq -o read_R2.ad.fastq 2> read_R2.as.stdErr
fastx_clipper -a ACTTGA –i sample.fastq –o sample.ad.fastq –v –Q 33
The above command will call the tool fastx_clipper,
(-a) states the sequence of the adapter,
(-i) allows you to define your input fastq file
(-o) states what your ouput file should be named. we add the extension; ad.fastq to distinguish the input and output.
(-v) verbose allows reports to be printed to the STDERR.
Read Trimming
Trimming your data would be the next step after looking at its quality and making judgment on what data you need to trimWe will look at how to do adapter trimming using:
- SolexaQA We will begin by trimming using solexaQA, the function DynamicTrim in the program is the read trimmer that individually crops each read to it’s longest contiguous segment for which quality scores are greater than user-supplied quality cutoff. SolexaQA plots some graphs using R so it is necessary to load it into the environment
- FASTX-Toolkit Fastx-toolkit can be used to filter out low quality reads using the
module load R
mkdir dynamictrim
SolexaQA++ dynamictrim read_R1.ad.fastq -h 22 -b -d dynamictrim/ --sanger
The above command will call the program SolexaQA and R.
(SolexaQA++ dynamictrim) calls the dynamic trim function of the program,
then the input / read to be process (read_R1.ad.fastq) is stated, this should be the adapter trimmed fastq file.
(-h) allows you to state the phred quality score cutoff for trimming
(-b) uses the BWA trimming algorithm.
(-d) path to directory where output files are saved
(--sanger) states the fastq format of the data in this case Sanger FASTQ format.
This allows you to process one sample at a time but you can make a batch script that will process several samples in the background as shown below. Write out the is bash script using vim, save the script by the name dynamicTrim.sbatch and run/submit the job by running
#SBATCH -p batch
#SBATCH -n 8
#SBATCH -J dynamictrim
#SBATCH -w taurus
#load the programs needed Solexa and R
module load SolexaQA++/3.1.3
module load R
# create a directory to direct your results
rm -rf dynamictrim
mkdir dynamictrim
#Run fastqc on all the “.ad.fastq” files in your current directory
for i in *.ad.fastq
do
SolexaQA++ dynamictrim $i -h 22 -b -d dynamictrim/ --sanger
done
You can as well trim sequences by base positions using
fastq_quality_filter -q 20 -p 80 -Q 30 -i read_R1.ad.fastq | fastx_trimmer -f 15 -Q 30 -o read_R1.ad.trim.fastq
call the tool fastq_quality_filter,
(-i) states the input / read to be process
(-q) minimum quality score to keep
(-p) Minimum percent of bases that must have
[-q] quality
(|) the pipe passes the results of the fastq_quality_filer to fastx_trimmer.
its an easy way of passing results of one program to the next. The options
(-f) states the first base to keep “any base before 15 in this case is trimmed off”
(-l) last base to keep can also be stated if you want to trim the 3’ end of your data.
(-o) states the output file to which results should be written.
Try this now:
 Run FastQC on the adapter-trimmed reads, and then on the adapter- and quality-trimmed reads, and examine the output.
Adapt this script and modify accordingly for batch processing:
do
echo working with "$i"
newfile="$(basename $i .fastq)"
fastq_quality_trimmer -Q33 -v -t 20 - l 20 -i $i |fastx_clipper -Q33 -a GATCGGAAGAGCACACGTCTGAACTCCAGTCACATCACGATCTCGTATGCCGTCTTCTGCTTG - l 20 -n -v > ${newfile}.trimmed.clipped.fastq
done;
That’s it! Now you’re ready to use the trimmed reads in any number of downstream pipelines. Keep in mind that you may want to trim and/or error correct differently, depending on what you’re doing downstream. For example, most aligners are tolerant of a few N’s in the sequence, but some assemblers are not flexible with N’s and ambiguous bases. If you have enough depth, it’s better to toss away reads containing N’s. There’s lots of room for experimentation and optimization. Take chances, make mistakes!
Optional: Additional steps
- Duplicate reads and singletons The bash script below first uses fastx_collapser to combine and count all identical reads. A FASTA-formatted file called
- Quality stats Summarize quality score and nucleotide distribution data, and plot using the Galaxy web server. The bash script uses fastq_quality_stats to summarize the data in the FASTQ file by read position (1-50 or 101) into a file named YOURFILE_qualstats.txt
- Combine Paired Read If you have sequenced some or all of your samples with Paired-End sequencing, you will for these need to sort your two FASTQ files so that reads are in the same order in both files, and so that any reads present in one file but not the other ("orphans") get separated out into a separate file.
do
echo working with "$i"
newfile="$(basename $i .trimmed.clipped.fastq)"
fastx_collapser -Q33 -v -i $i -o temp.collapsed.txt
python ../scripts/fastqduplicatecounter.py temp.collapsed.txt temp.collapsed.headers.txt>> ${newfile}.duplicateCount.txt
rm temp.collapsed.headers.txt
rm temp.collapsed.txt
done;
Copy the lines to reflect the number of files that you are analyzing, change all the input and output file names in the script to match your data, then re-save the bash script. (As above, you will need to specify the quality score offset for each of the fastq_quality_stats commands with the –Q flag if it is not 64.)
Plot it under NGS: QC and manipulation: Fastx Toolkit for FASTQ data. Choose files to plot under "Draw Quality Score Boxplot" and "Draw Nucleotide Distribution Chart" (you don't have to wait for one plotting job to be done before starting the next one), then save the plots on your computer. They should look something like Figures below
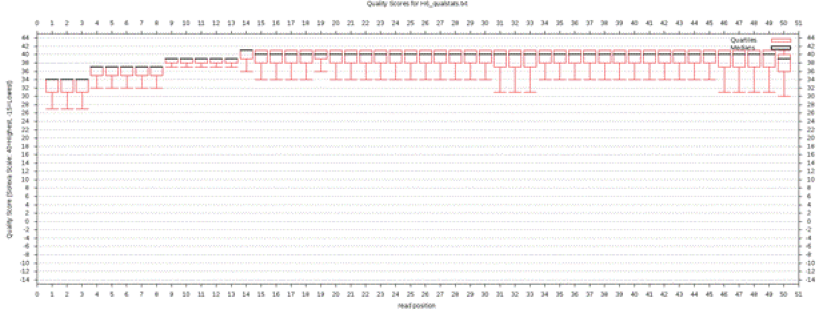 Quality score boxplot of 50-bp Illumina reads (after quality trimming, Q>20), summarized by read position. Lower scores in the beginning of the reads is an artifact of the software used to calculate base quality scores. |
 Nucleotide distribution chart of 50-bp Illumina reads, summarized by read position. A non-random distribution in the first 12 bases is common, and is thought to be an artifact of the random hexamer priming during sample preparation. |
Edit the paired end combiner
The bash script uses fastxcombinepairedend.py to sort your two FASTQ files so that the reads who are in both files will be in the same order. It also removes all reads only present in one file and saves them in another file. Notice that this script needs a SEQHEADER and a DELIMITER argument in addition to filenames.
How do I know the SEQHEADER and DELIMITER
In the Terminal, type SEQHEADER will be the first 4 characters of this line (including the @ symbol).
DELIMITER will be the character separating the last part of the identifier (that tells the software if the read is a forward or reverse read) from the rest of the identifier. It is usually either a "/" or a " " (space) character.
Enter your SEQHEADER and DELIMITER into the PECombiner.sh bash script, then copy the line to reflect the number of files/ samples / sequence files that you are analyzing, change all the input and output file names in the script to match your data and finally re-save the bash script.
While in the folder containing your data, execute the bash script by typing:
I: YOURFILE_trimmed_clipped#1_1.fastq (forward)
YOURFILE_trimmed_clipped#1_2.fastq (reverse)
O: YOURFILE_1_trimmed_clipped_stillpaired.fastq
YOURFILE_2_trimmed_clipped_stillpaired.fastq
YOURFILE_trimmed_clipped_singles.fastq
Summary
We have now cleaned up the raw data, so that they can be used for creating a de novo assembly or for mapping against a reference.Low quality bases and adapter sequences have been removed. We have also verified that the reads are not all identical, which would suggest an error somewhere in the sample preparation pipeline. We have also examined the trimmed dataset to make sure that quality scores are high and that nucleotides are evenly distributed.