Basic sequence analysis
| This portal serves to introduce various bioinformatics resources and tools to aid ABCF placements analyse and intepret their data. | 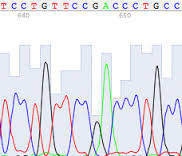 |
Overview: Basic steps to sequence analysis
| High quality reads | Poor quality reads |
|
- no ambiguities - no noise - peaks very well spaced | - some ambiguities - the difference between noise and signal is very small - the overall amplitude of the signal is small - overlapping peaks - low confidence in bases assignment (low confidence score) |
That computer program, however, does make mistakes and you need to manually double-check the interpretation of the primary data. Predictable errors occur near the beginning and again at the end of any sequencing run (loss of resolution). This require trimming of some nucleotides from the ends. Other errors can crop up in the middle (miscalled bases), invalidating individual base calls or entire swaths of data. The sequences of clones from DNA libraries frequently contain vector sequence, polyA tails, or other unrelated sequence. Introns and primer sequence frequently flank the sequence of amplified exons. Unless removed by trimming, any of these artifacts will distort your sequence assembly and downstream sequence analysis. Watch for multiple bases of any one nucleotide where there really should be only one; and wide peaks mis-counted by the program as two nucleotides, when it should have been just one. Wide peaks may also obscure smaller adjacent peaks.
- Sequence Assembly & consensus by confidence Sequence assembly is aligning and merging fragments (typically the forward-reverse strands / read 1-read 2) from a longer DNA sequence in order to reconstruct the original sequence. This is because each sequencing paltform has an optimum fragment length that it can accurately sequence. Merging the fragments enable us to result in a longer, reliable contig (contiguous sequence).
Sequence assembly may be with, or without requirement of reference sequence

Basic sequence analysis using CLC Main workbench
The functionalities of CLC Main Workbench are used for DNA, RNA, and protein sequence data analysis, such as gene expression analysis, primer design, molecular cloning, phylogenetic analyses, and sequence data management, amongst a wide variety of other features

Using MEGA
MEGA is an integrated tool for conducting sequence alignment, inferring phylogenetic trees, estimating divergence times, mining online databases, estimating rates of molecular evolution, inferring ancestral sequences, and testing evolutionary hypotheses.