The CLC Main Work bench is software package that supports analysis of your sequence data. The data analysis shown is of sequenced data generated by Sanger sequencing.
The functionalities of CLC Main Workbench are used for DNA, RNA, and protein sequence data analysis, such as gene expression analysis, primer design, molecular cloning, phylogenetic analyses, and sequence data management, amongst a wide variety of other features – all wrapped in an intuitive graphical user-interface.CLC Main Workbench is available on Windows, Mac OS X, and Linux platforms.
Definitions Sequence assembly: aligning and merging fragments of a much longer DNA sequence in order to reconstruct the original sequence.
Assembly to a reference sequence: assembly of the sequenced fragments using a similar sequence (a reference sequence) as a guide.
De novo assembly: assembly using only your sequenced fragments. This can be more difficult if the region of overlap is very small.
Conflict: a nucleotide position in the assembled sequence overlap which has different bases, or where there is a gap on one sequence and a base at the corresponding position on the other sequence.
DNA Contig: Contiguous sequence of DNA created by assembling overlapping DNA sequence reads. It consists of a multiple sequence alignment of sequence reads plus a consensus sequence.
Consensus sequence: A sequence of nucleotides [or amino acids] in common between regions of homology in related DNA [or protein] sequences.
Getting started
Download the workbench from the link provided above
Open the CLC Main Workbench software
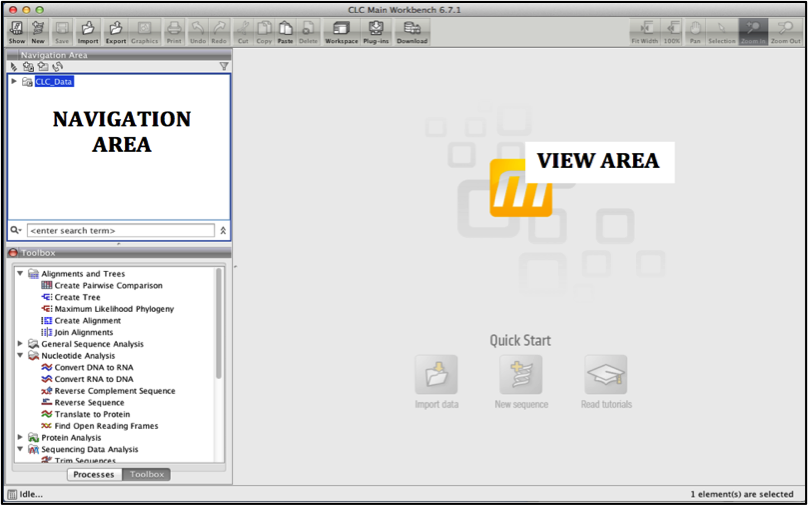
The user interface of CLC is as below: there is Navigation area and a View area.
Navigation area is where all the data imported into CLC is kept.
View area is the main window to the right, where data is viewed and manipulated.
Figure 1
Creating a folder, it is best to organize data in the navigation area in folders.
To create a folder go to
File | New | Folder
Or
click on the new folder icon on the tool bar
Name the folder “My_folder” or a name of your choice; and press enter.
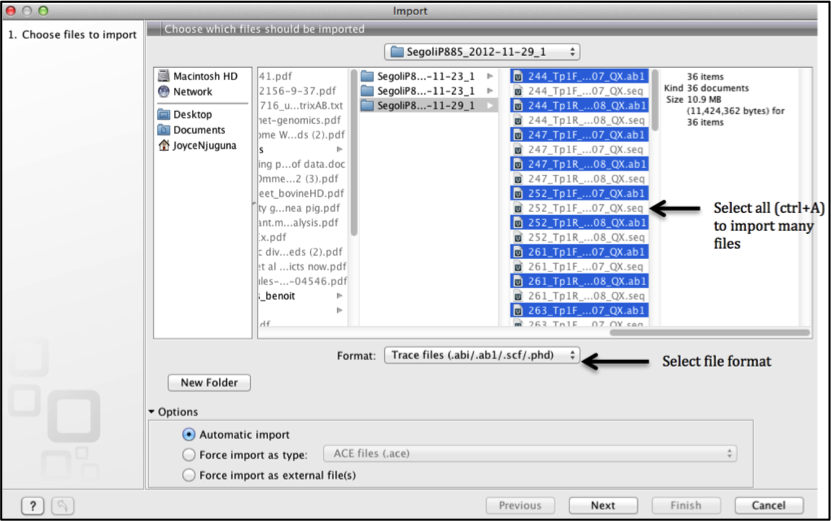
Importing data: Allows you to bring sequenced data into CLC from where it is stored on your computer. You can import many file types but in this tutorial we will look at importing trace files for further analysis.
>Go to
File | import or click the import icon on the tool bar.
Navigate to where your sequences are stored on your computer
Select the file format to import.
In the case of sequenced data select Trace files (.abi/.ab1/.scf/.phd).
Fig 2
Select all the sequences you want to import (to import them concurrently) and click next.
Select the folder to save the sequences to in CLC- in this case highlight My_folder and click finish
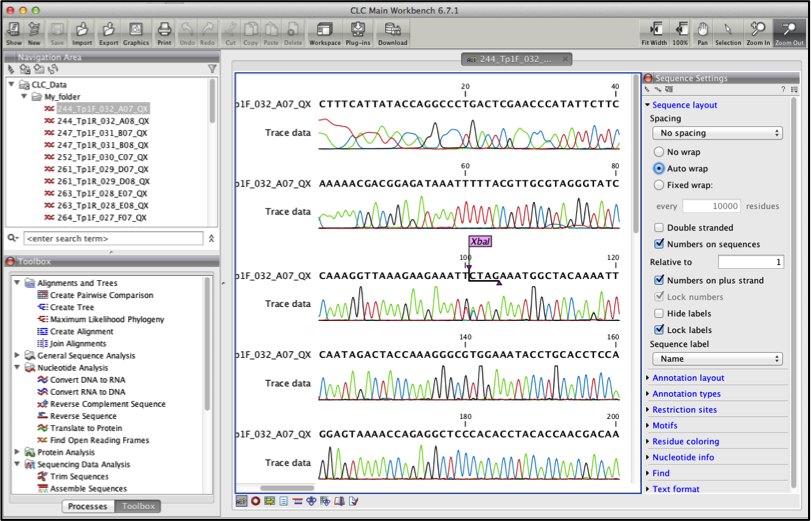
The data is imported into CLC if you expand My_folder in the navigation area you should see your sequences
Double click the sequence in the Navigation area to view it Figure 3.
Your imported sequences should look as below Figure 3.
Fig 3
Trimming the sequences: The first step when analyzing the sequencing reads is to trim them. Trimming eliminates reads of poor quality (and in the case of cloned inserts removal of vector contamination).
To trim sequences go to Toolbox menu
Sequencing Data Analysis | Trim Sequences
This gives the trim sequences dialogue box.
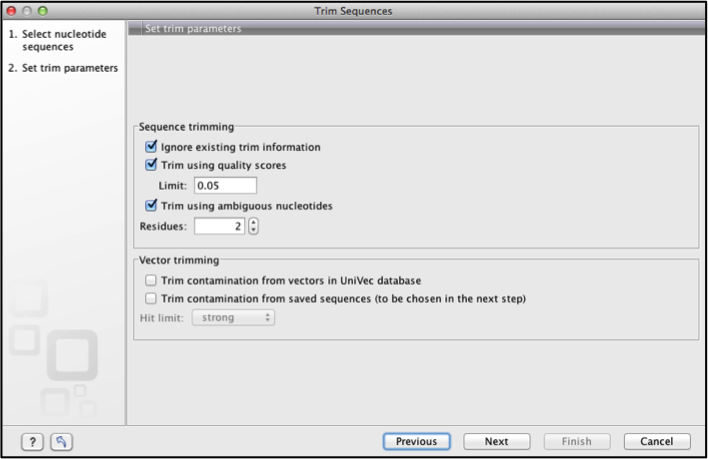
Select all the sequences to be trimmed on the left panel and use the arrow to move them to the right panel, click next.
Specify the trimming parameters the limit on trim quality scores can be increased or reduced to make trimming more or less stringent respectively
If the sequences were cloned products select the vector trimming options.
Click next and choose to save the results.
Fig 4
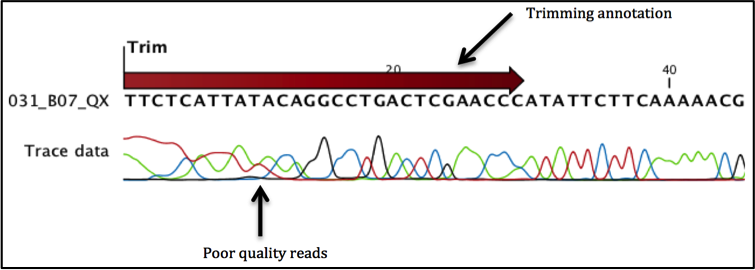
When the trimming is done the parts of the sequences that are trimmed are not actually removed but trim annotations are saved to the sequences. These annotated sections are ignored in further analysis.
Fig 5
Assemble sequences: In most cases forward and reverse primers are used, hence on sequencing you end up with a forward and reverse sequence. Assembling the two sequences aligns the sequences where they overlap to get a contiguous sequence called a contig.
Assembly can be done to a reference sequence
- Comparison with a similar sequence obtained from a sequence database Or
De novo assembly: common in the cases that you do not have a reference sequence to the sequenced data.
Go to
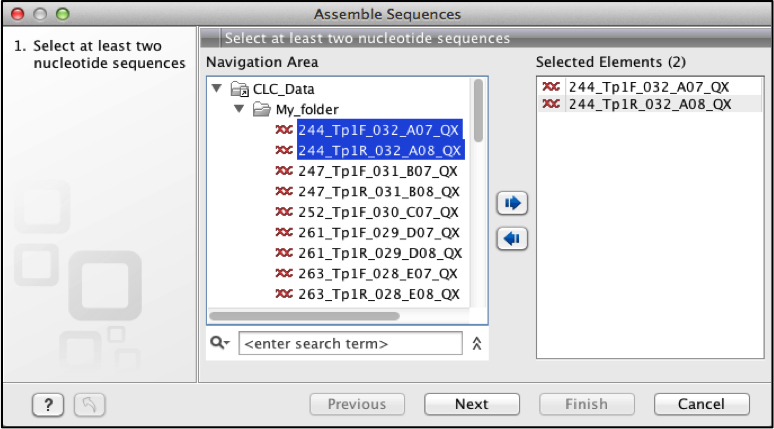
Toolbox | Sequencing Data Analysis | Assemble sequences
This gives a dialogue box on the left panel select the forward and reverse sequences you want to assemble and move them to the right panel.
Fig 6
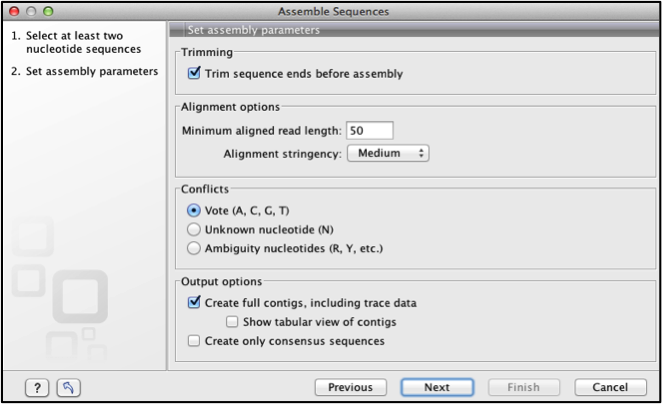
Click next, this dialogue box allows one to define assembly parameters see Figure 7 below
Fig 7
You can increase or decrease the alignment options to change the stringency of the alignment.
Conflict can be voted on (A, C, G, T), Assigned degenerate bases or assigned an N for ambiguous base when conflicts arise in the overlapping regions; where the forward and reverse strand have different bases at the same position. This can be resolved at a later stage.
Output options, select create full contigs, including trace data. Click next.
The next dialogue box allows you to set trimming parameters if you had not trimmed the sequences prior to this, click next
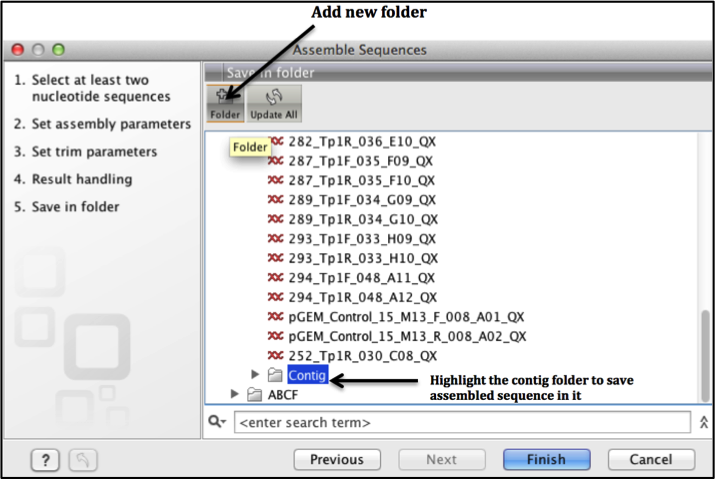
Select the save option to save your assembled contig.
To avoid mix up of your data, we suggest that at this point you create a new folder by clicking on the new folder icon (see Figure 8 below) and label it "Contig" and save your contig here click finish.
Fig 8
The assembly process occurs and the contig is saved to the indicated file in the navigation area. In the case that the sequences do not assemble an error message indicating failure to assemble is flashed on the screen.
Your navigation area should have the new folder Contig, expand it to view the assembled contig. The contig should be labeled contig 1 , rename it appropriately (rename by highlighting the contig go to
Edit | rename
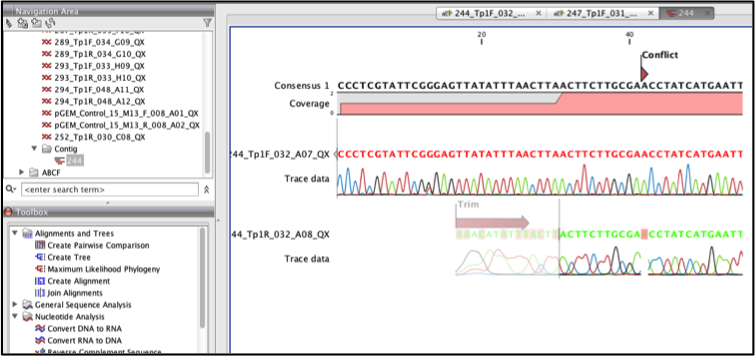
The contig can be viewed by double clicking on it, the contig should appear as in Figure 9 below having the alignment of forward and reverse sequence and a consensus sequence. You can also see the regions that were trimmed, and any base conflicts that occur between the forwards and reverse sequences. Coverage indicates the regions of the consensus that were derived from one or both sequences
Fig 9
Finding and editing conflicts: Conflict may arise during sequence assemble, as a result of a mismatch in the overlapping regions of the forward and reverse sequences.
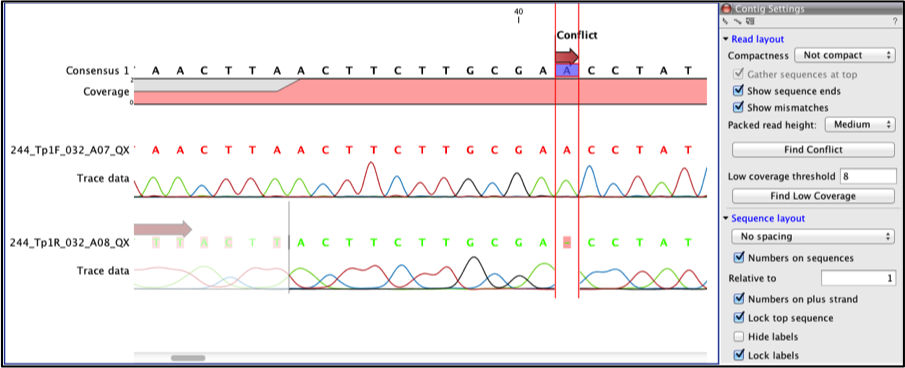
To find any conflict in the contig click the find conflict button on the side panel. You can zoom in using the zoom in tool on the tool bar to improve visualization see Figure 10 below.
Fig 10
The above example shows a conflict in which the forward strand shows a base call of “A” and the reverse strand shows a gap in that position.
We assess the quality of reads at this position. A look at the reverse sequence shows us that the quality of chromatograph traces is low (this is often the case towards the ends of the sequence). However the forward strand clearly has good quality peaks and can be trusted. Hence the conflict is resolved by selecting the gap in the reverse sequence (use the selection tool and drag the cursor over the gap to select it) and replace it with an “A”. An editing warning pops-up, click ok to accept changes to the trace file, the arrow above should now turn green and reflect “Resolved conflict”. Click the find conflict button again to resolve the next conflict.
Other conflicts may occur between two nucleotides, judgment on how to resolve such conflicts should be made based on:
Quality of reads on both strands (take data from the most consistent sequence)
Which of the peaks is of better quality
In some cases two bases may be picked on either sequences because it is genuinely a SNP position. Judgment should be based on quality of reads but also background knowledge on the sequences been analyzed.
Degenerate codes – are used in the case that you cannot resolve conflicts.
Saving the consensus sequence: When done editing the contig, you can extract the consensus sequence to be used for further analysis.
Right click on the name “consensus”
Open copy of sequence | Save
This will make it possible to use the sequence for further analysis.
It is recommended that you create a separate folder to save the consensus sequences to avoid mix up with trace files or contigs.
Exporting sequences: You can export your consensus sequence out of CLC and save it in another location on you computer.
Highlight the sequence and go to
File | Export or click the export icon on the task bar
This brings a dialogue box that allows you to select the file format you want to save your sequence in and the location in your computer to save the sequence file.
You can select to export your sequence in the FASTA (.fa / .fsa / .fasta) format as it is common import for many sequence analysis programs.
Sequence alignment using CLC Main workbench
CLC Main workbench can align two or more sequences to find regions of similarity.
To align sequences you need to use the consensus sequences or input sequences in fasta format:
From the toolbox menu select Alignment and Trees | Create Alignments
This brings a dialogue box allowing you to select the sequences to align. Move the sequences you want to align to the right panel and click next.
Set parameters for the alignment algorithm
You can choose to increase the gap settings to make the alignment more stringent.
Select either fast (less accurate) or slow (very accurate) alignment
Fast alignment allows for use of an optimized fast algorithm, which is best for very long sequences. Slow alignment is preferable though it may take long
You can choose to open the alignment and view it or save it.
Double click the alignment to view it.
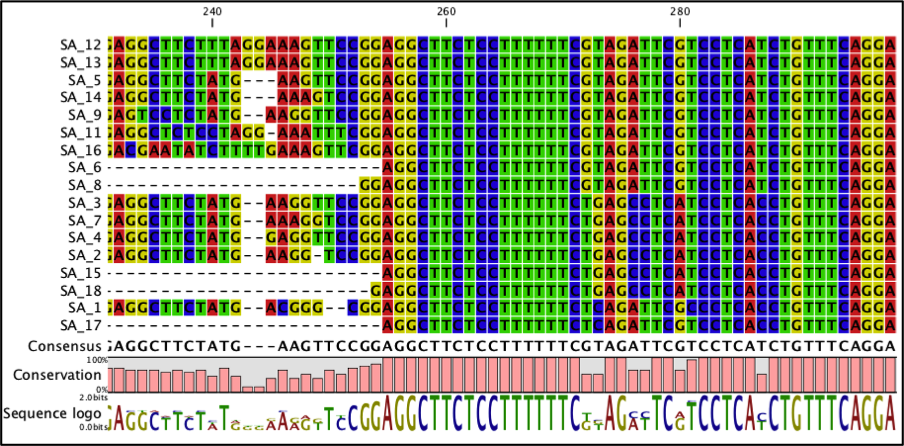
The alignment should look as in Figure 11 below. The bases that are conserved in the alignment are highlighted and the sequence logo displays the frequency of residues at each position.
Fig 11
Building Phylogenetic trees in CLC Main Workbench
It is possible to infer evolutionary relationships for aligned sequences. In CLC this can be done either by distance based methods or by statistical methods (Maximum likelihood approach)
From the toolbox menu select Alignment and Trees | Create Trees
This allows one to create distance based phylogenetic trees.
For Maximum likelihood trees toolbox menu select Alignment and Trees | Maximum Likelihood Phylogeny
This options open up a dialogue box that requires you to select the alignment on which your tree will be built. Select the alignment on the left panel and move it to the right panel and click next.
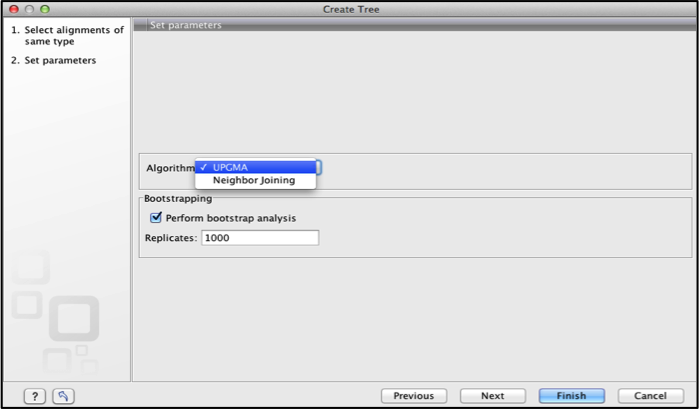
The set parameters dialogue box allows one to set the tree parameters.
For the distance based methods the tree building parameters include:
Selecting the algorithm. Either UPGMA or Neighbor Joining.
UPGMA method assumes the evolution has occurred at a constant rate in the different lineages hence the root of the tree is estimated.
Neighbor joining: building a tree where the evolutionary rates are free to differ in the different lineages
Bootstrap analysis is also done to evaluate the reliability of the inferred trees. The wizard allows one to adjust the number of replicates of bootstrap analysis.
Click finish to create the tree.
Fig 12
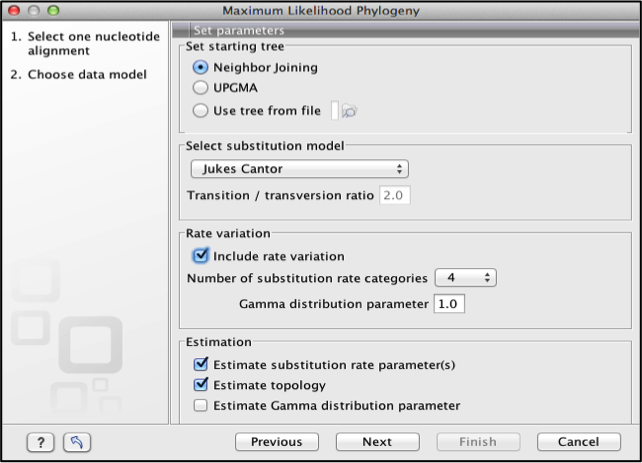
For the Maximum Likelihood tree, a number of parameters are set,
Set starting tree: specify a starting tree for the tree reconstruction:
Neighbor joining
UPGMA or
A tree from a file
Select substitution models. Maximum likelihood is estimated under the assumption of one of four substitution models
Jukes Cantor (Jukes and Cantor, 1969)
Kimura 80 (Kimura, 1980)
HKY (Hasegawa et al., 1985)
GTR (Yang, 1994a)
Rate Variation: Substitution rates can be allowed to differ among the individual nucleotides by selecting the Include rate variation option.
Estimation: Selecting the estimate substitution rate option maximum likelihood values of the free parameters in the rate matrix describing the assumed substitution model are found. If the Estimate topology option is selected, a search in the space of tree topologies for that which best explains the alignment is performed. The Estimate Gamma distribution parameter allows estimation of the Gamma distribution parameter to be switched on or off.
Click next and choose either to save or open the tree and click next to finish the tree is generated and displayed. Once the tree is generated various tree view preferences can be selected, change the Tree layout or labels as desired.