GeneMapper pre-processing
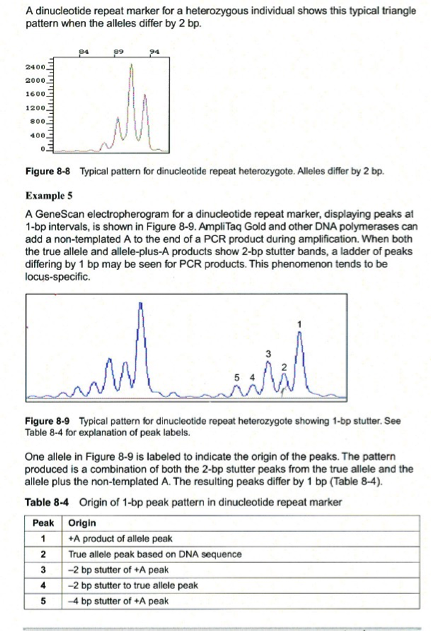
Microsatellite markers, also known as short tandem repeats (STRs), are polymorphic DNA loci consisting of a repeated nucleotide sequence. The number of repeat units varies in a population, thereby creating multiple alleles for a microsatellite locus.
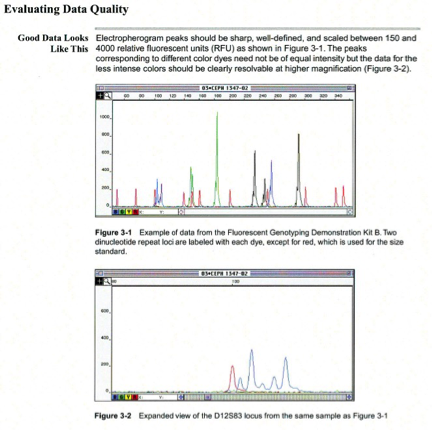
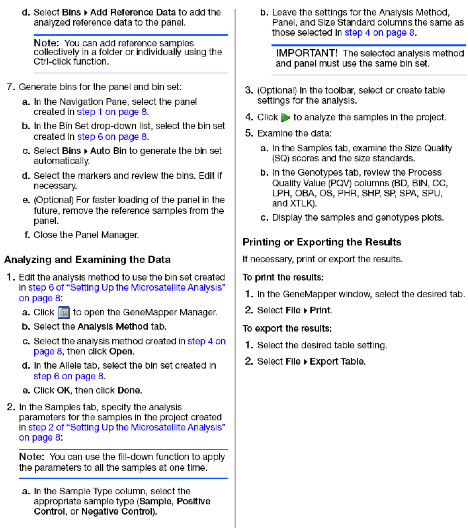
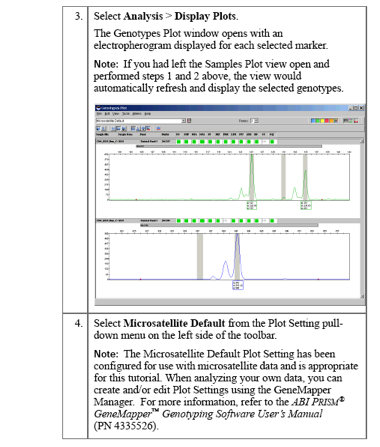
In a typical microsatellite analysis, microsatellite loci are amplified by PCR using fluorescently labeled forward and unlabeled reverse primers. The PCR amplicons are separated by size using electrophoresis; then the dye labeled products are identified by fluorescence detection. You can then use the GeneMapper Software to size and genotype the alleles.
Logging in to GeneMapper
Click theUser: gm
Password: genetics1
Database host: (specific to computerName)
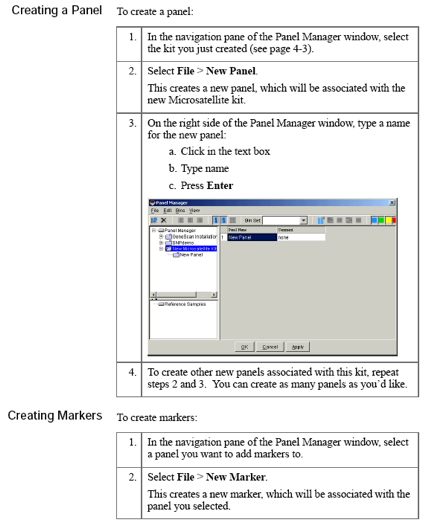
Creating new project
A project contains a set of samples for analysis.Either open an already existing project or create a project. A new project (for files copied from Segoli) is created as follows:
- an analysis method,
- a size standard, and
- a panel Samples not associated with a panel will only be sized, whereas samples associated with a panel will be genotyped).
- In the Analysis Method column, select one of the methods that applies to your samples (Microsatellite default)
- In the Size Standard column,
- select the size standard that you added in the samples. For ABI 3730, use GS500LIZ-3730. This size standard is the same as GS500LIZ but the 35, 250 and 340 bp are excluded in GS500LIZ-3730 due to their instability for high temperature generated by the sequencer.
- Click the Analyze button (or go to Analysis menu and select Analyze).
- Write Project name and click OK. Wait until GeneMapper completes analysis.
The above preliminary analysis helps to check sizing quality, peak quality (pull-ups, off scales, baseline, etc.), and peak height. - For detailed analyses, you need to create a Kit, Panels, markers, binsets, bins, and modify the analysis method by specifying the binset.
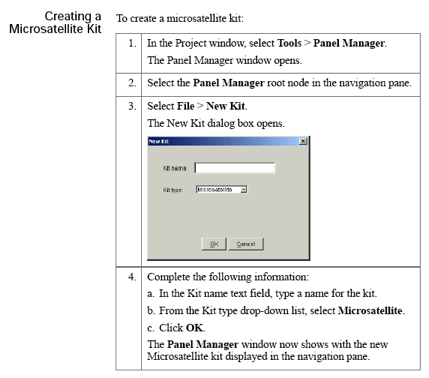
- Kits are comprised of panel (a kit is a group of panel).
- A panel is simply a group or set of markers. Each panel contains markers of different dye colors whose allele size ranges do not overlap.
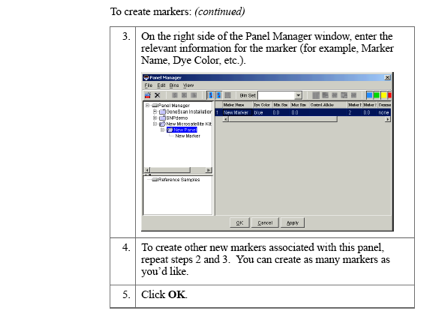
- A marker represents a specific genetic location. Markers are made up of one or more bins of a single dye color.
- Bins are a fragment size or base pair range combined with a dye color that defines an allele. Bins are typically created from a set of reference data samples. You create a bin for each possible allele associated with a marker. When a peak from a data sample matches the location of a bin, the software is able to make an allele call.
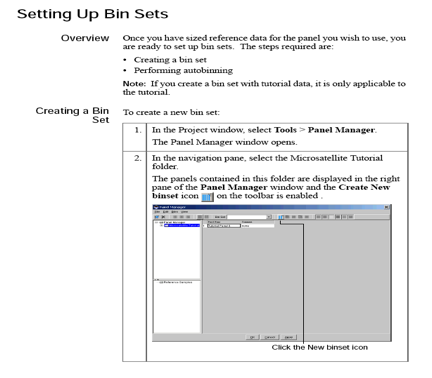
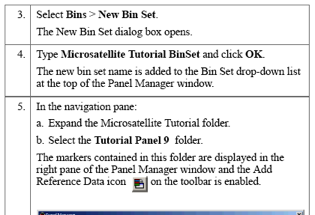
- Bin sets represent a set of bin definitions for one source or set of experimental conditions, usually an instrument.
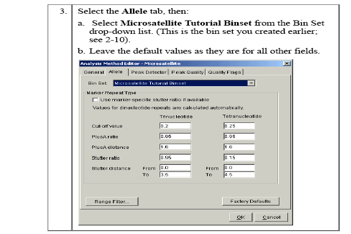
- The allele settings associate the bin set with the analysis method so that the software can identify allele
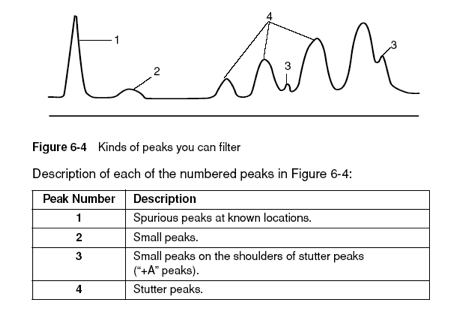
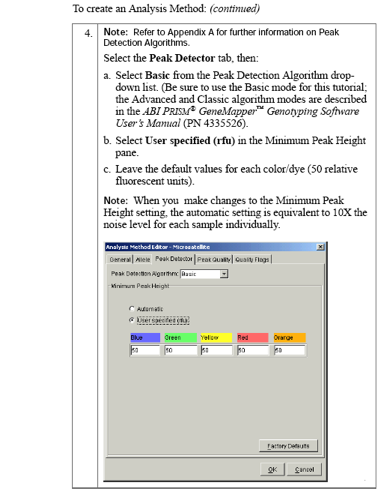
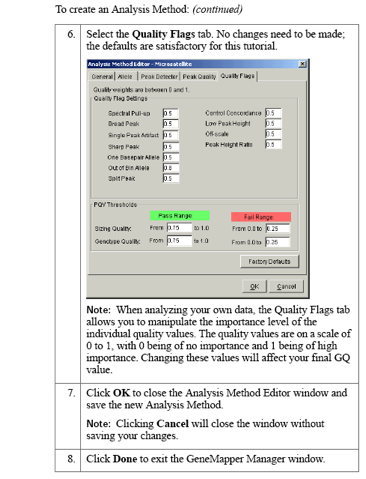
- The peak quality settings help the software distinguish good peaks from bad
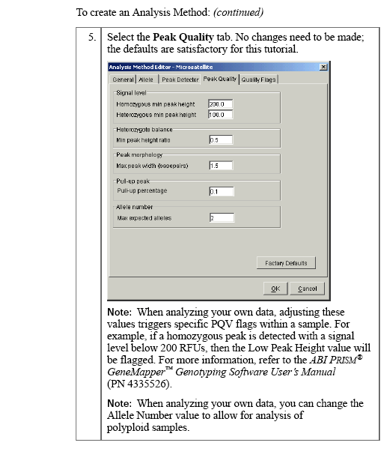
- The quality flags settings define the weighting an threshold for classifying results as pass, checks or fail
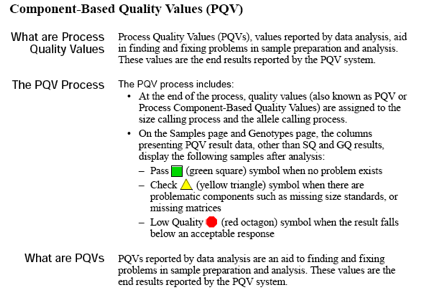
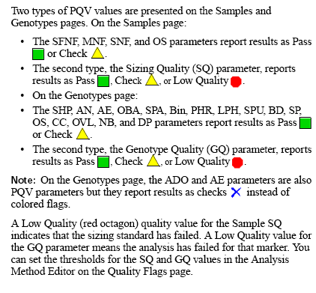
- For samples, review sizing quality
- For genotypes, review the genotype quality
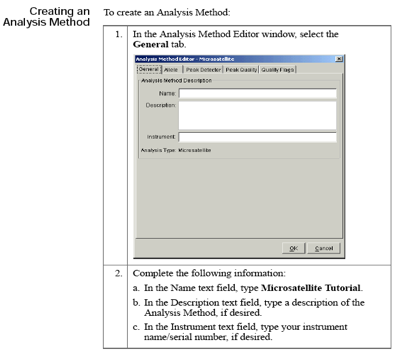
Analysis method: A collection of parameters set by the user to determine the bin set and analysis algorithms. The analysis method contains settings for: (1) generating peaks, (2) performing allele calls, and (3) conducting quality control.
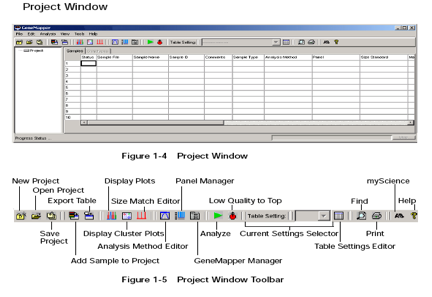
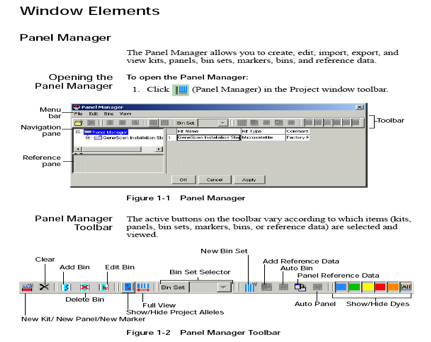
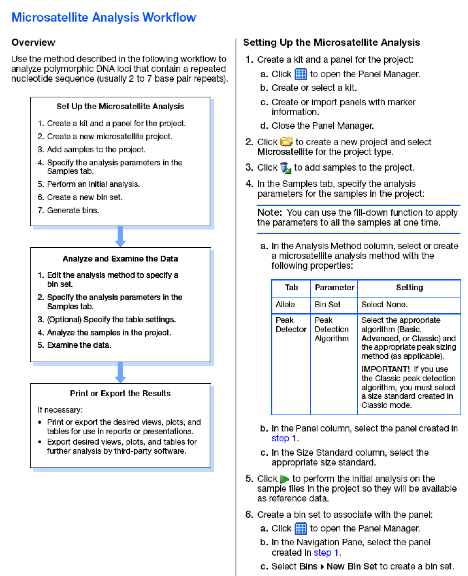
Panel Manager: The Panel Manager allows you to create, edit, import, export, and view kits, panels, bin sets, markers, bins, and reference data. The structure of kits, panels, markers, and bins is maintained in the Panel Manager window.
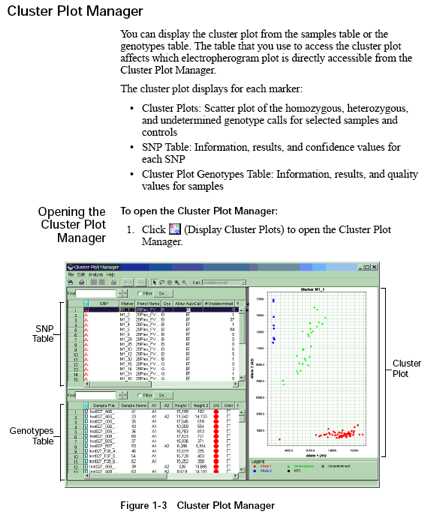
Cluster Plot Manager: You can display the cluster plot from the samples table or the genotypes table. The table that you use to access the cluster plot affects which electropherogram plot is directly accessible from the Cluster Plot Manager.
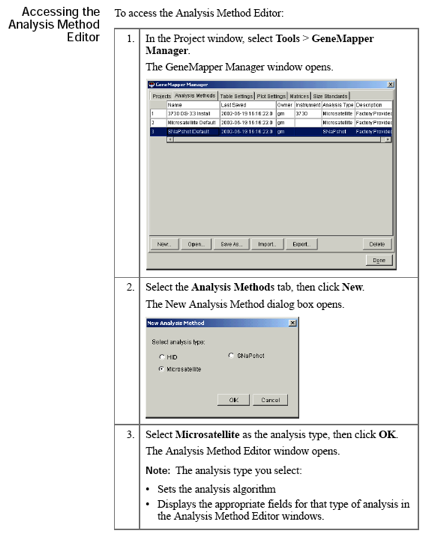
GeneMapper Manager
Use the GeneMapper Manager to create, open, edit, import, export, and delete:- Projects
- Analysis methods
- Table settings
- Plot settings
- Cluster plot settings
- Matrices
- Size standards
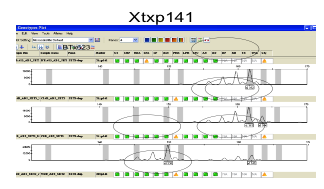
Pull-up peaks
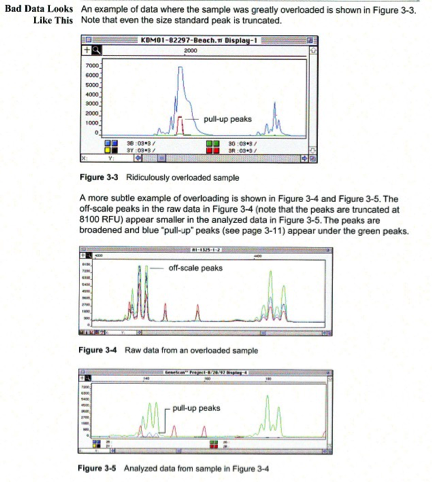
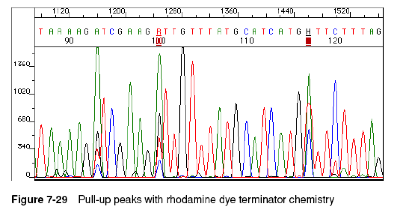
Figure 7-29 shows rhodamine dye terminator data collected on an ABI PRISM 377 DNA Sequencer. The data has pull-up peaks (also known as bleedthrough), multiple peaks in the same position at some points. Pull-up peaks are caused by very strong signals that saturate the detector. These signals are therefore clipped digitally (truncated). The software underestimates the amount of signal at these positions, so it also underestimates the amount of spectral overlap to correct. Hence pull-up peaks are seen. These extra peaks are consistently observed at places in the electropherogram where there is a tall peak. Usually, they are of only one color. Occasionally, when the signals are very strong, more than one pull-up peak color is observed, as in Figure 7-29. In this figure, the total signal strength shown in the annotation view is 6077, which is much higher than the recommended maximum of 4000 (1000 for each base).You can also look in the raw data to determine if signals are too strong. After zooming in, if any peaks are truncated at the top (i.e., off-scale) then pull-up peaks may be observed in the analyzed data.
Another influence on pull-up peaks is the sequence-specific peak patterns associated with each chemistry. The rhodamine dye terminators have several peak patterns in the electropherogram data where very strong signals occur. The dRhodamine terminators and BigDye terminators have more uniform peak heights that lessen the potential for individual signals to go off-scale. However, if combined signals are above 4000, then pull-up peaks are likely to be observed.
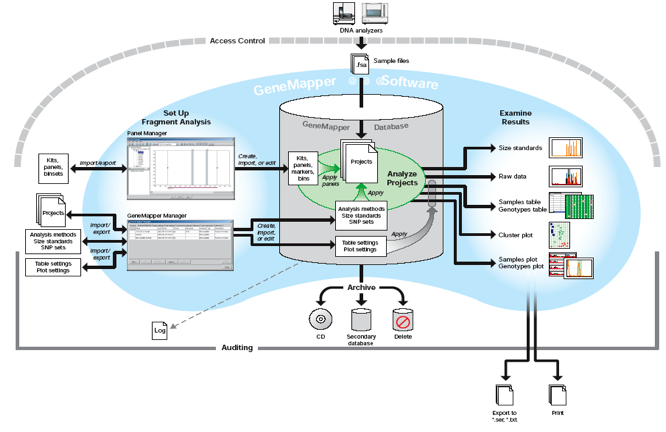
Process Flowchart
To get more options for the Peak Detector tab, select
- Ranges: Full range or Partial
- Peak Detection
- Smoothing and Baselining: None, Light, Heavy
- Baseline window
- Size Calling Method
- Min. peak half width
- Polynomial degree
- Peak window size
- Slope threshold
Examples:
Exporting result tables: